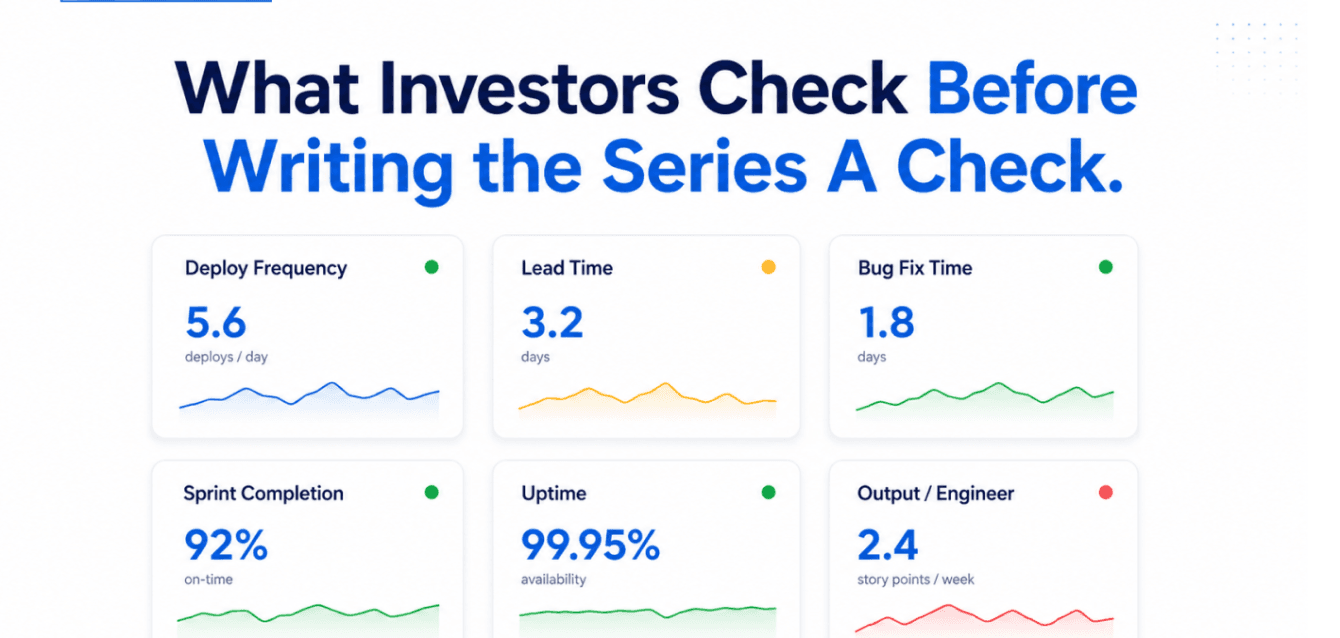
Engineering velocity Series A investors assess has become a critical part of startup fundraising conversations. Approximately 60 percent of institutional Series A investors include some form of technical due diligence in their investment process. Many of the practices discussed in this article align with established technical due diligence frameworks used by leading venture capital firms. However, this diligence is rarely a line-by-line code audit.
Instead, investors want to understand whether your engineering team can consistently ship product improvements, respond quickly to customer feedback, and execute fast enough to achieve the growth milestones that justify the valuation they are being asked to pay. In other words, they are evaluating engineering velocity as a proxy for execution capability and operational maturity. This article covers the six metrics investors commonly examine, what “good” looks like at the seed stage, and how founders can present those metrics effectively without needing a dedicated data science team.
While every investor has a different diligence process, many of the indicators they evaluate closely align with the industry-standard DORA software delivery metrics, which measure software delivery performance and operational reliability.
The 6 metrics Series A investors assess
1. Deployment frequency.
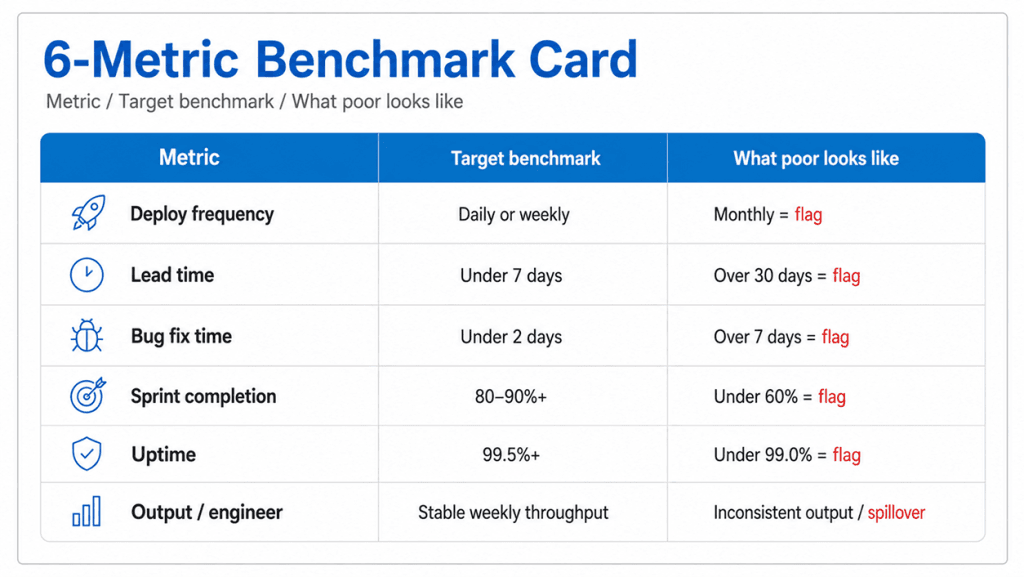
Target: daily or multiple times per week. Monthly = a yellow flag, suggesting a manual deployment process, a fragile codebase, or a cultural fear of shipping. The question behind this metric: is the team able to iterate on user feedback quickly? A team that deploys once a month cannot respond to what users are telling them.
2. Lead time for changes.
This measures the time from a completed feature in development to that feature reaching production. The target is under one week for a typical feature. A lead time of three to four weeks consistently suggests an inability to iterate at the pace expected during a Series A growth stage. The question behind this metric is how much overhead exists between an engineer completing the work and users seeing the update. It is one of the core indicators engineering velocity Series A investors use to evaluate a startup’s execution speed.
3. Cycle time on bug fixes.
Target: critical bugs resolved within 24 hours, non-critical within one week. Long bug cycle times signal either insufficient engineering capacity or insufficient operational discipline. Both concern investors who are about to hand you $5,000,000 to scale the product.
4. Sprint completion rate.
Target: 80 percent or above. Below 60 percent consistently suggests the team is either scoping work poorly or committing to more than it can realistically deliver. Both are operational red flags. A single sprint with a 50 percent completion rate is normal, but a pattern of 50 percent across six sprints points to a management issue. This is another key indicator engineering velocity Series A investors review when assessing a startup’s execution discipline.
5. Uptime and incident response.
Target: 99.5 percent or above for a Series A stage product, incident resolution within four hours. Investors are increasingly asking to see monitoring dashboards — not because they understand every metric, but because the existence of a monitoring dashboard signals that the team knows what operational reliability looks like.
6. Output per engineer.
Qualitative, but real. A three-person team shipping one new feature per week outperforms a ten-person team shipping one per month. This metric is about organisation quality, not just engineering quality. A team that is well-managed and focused ships more per person than a team with high headcount and low coordination.
The Engineering Pod advantage in due diligence
SynthWeb’s Engineering Pod model produces a strong due-diligence profile across all six metrics that engineering velocity Series A investors commonly assess during technical due diligence. Sprint cadence is built into the engagement structure, deployment frequency is high by default (we ship to staging on every pull request and to production at least twice per sprint), and output per engineer is maximised through the pod’s focused, coordinated team model. As a result, clients entering a Series A fundraising round have the processes, documentation, and delivery history needed to demonstrate these engineering performance indicators with confidence—often without additional preparation.
How to present engineering velocity to investors
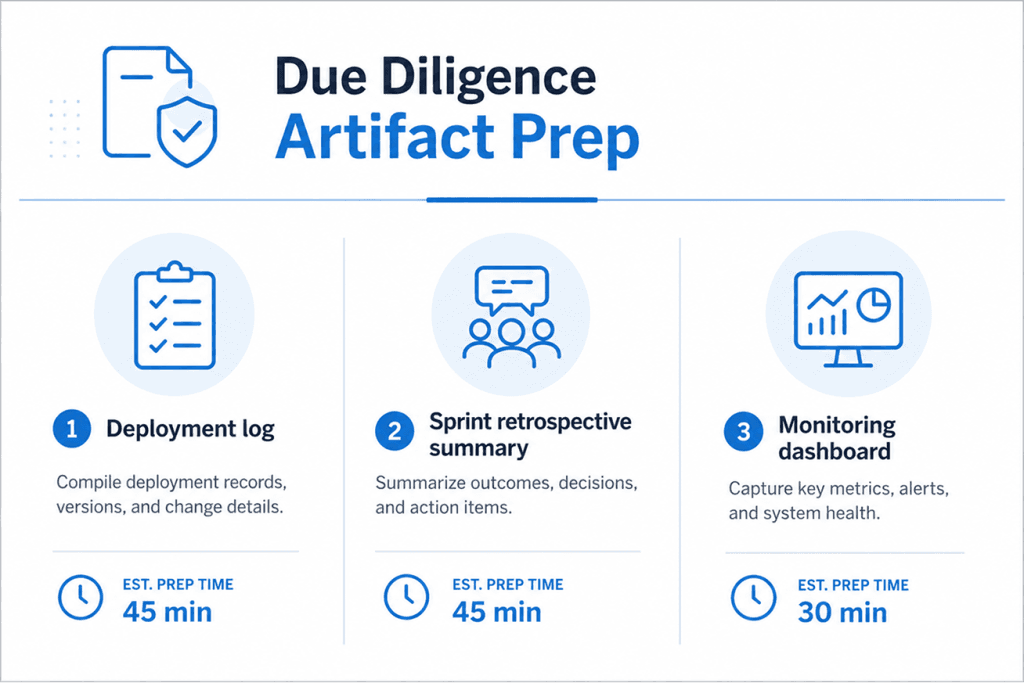
Three artefacts, approximately two hours to compile:
Deployment log from GitHub or Linear.
A chart of merge-to-production events over the last six months. Shows deployment frequency and lead time at a glance. If you use GitHub, the deployment frequency is visible in the Actions tab.
Sprint retrospective summary.
A one-page document showing sprint completion rates over the last three to six sprints, what slipped and why, and what the team did about it. Investors are impressed by teams that track misses and learn from them, not by teams that claim perfect delivery.
Monitoring dashboard screenshot.
Datadog, AWS CloudWatch, or an equivalent platform, showing uptime and incident count over the last 90 days. These operational metrics are among the key indicators engineering velocity Series A investors review to assess a startup’s technical maturity and execution capability. If you do not have a monitoring dashboard, creating one is a one-week Engineering Pod sprint, and the ROI during a due-diligence process is immediate.
FAQ
Do all Series A investors do technical due diligence?
No. Roughly 60 percent of institutional investors conduct technical due diligence, while many angel investors and smaller funds do not. However, engineering velocity Series A investors typically expect supporting metrics, so having the documentation ready is worthwhile.
Does SynthWeb help clients prepare due-diligence artefacts?
Yes — this is a standard CTO-as-a-Service workstream. See /cto-as-a-service.
What if our velocity metrics are poor?
Fix the underlying issues first. Two to three months of improved velocity shows a trend. A trend is more persuasive to investors than a single point of good data.
Also Read:
SOC 2 Readiness Startup Series A: 8 Critical Security Checks Investors Always Demand